
| Parent Asset | Child Object(s) | Tab Name Shown |
|---|---|---|
| Database | Schema | Schema |
| Schema | Table, View | Table / View |
| Table | Attribute (column) | Attribute |
| View | Attribute (column) | Attribute |
| Pipeline | Task | Task |
| Job | Task / Run | Task / Run |
| Warehouse | Database | Database |
Why Child Objects Matter
Child objects let you assess an asset’s internal structure before evaluating its quality, usage, or lineage:- A Database’s child objects (Schemas) show how it’s organized.
- A Table’s child objects (Attributes/columns) show exactly what data it holds.
- A Pipeline’s child objects (Tasks) show what steps make up the workflow.
Accessing the Entities Tab
- Navigate to any asset (e.g., a table, database, or pipeline).
- Click the child-object tab in the asset’s tab bar, located next to Overview (the tab name will match the child object type — e.g., Attribute, Schema, Task).
Layout
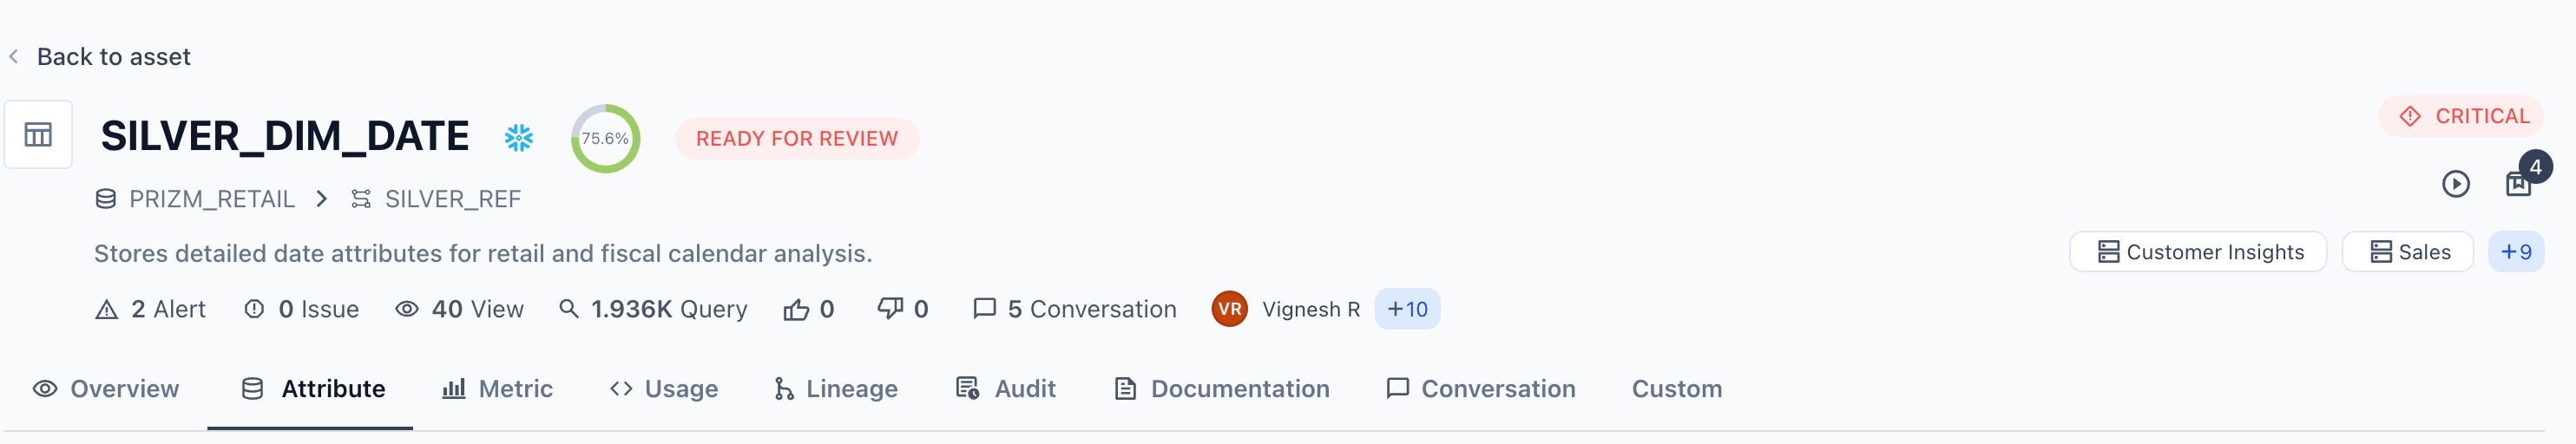
Asset Header (Context)
The header above the tab bar persists across all tabs and shows:- Asset name, source icon, quality score, and status badge (e.g., Ready for Review).
- Criticality badge (top-right, e.g., Critical).
- Breadcrumb path showing the asset’s location in the hierarchy.
- Short description of the asset’s purpose.
- Activity counters — Alerts, Issues, Views, Queries, Likes/Dislikes, Conversations.
- Owners and tags.
Entities List
- [Entity Type] (count) — total number of child objects (e.g., “Attribute (10),” “Schema (8)”).
- Type filter bar — where applicable, filter child objects by sub-type (e.g., data type for Attributes:
TEXT,NUMBER,BOOLEAN,DATE).
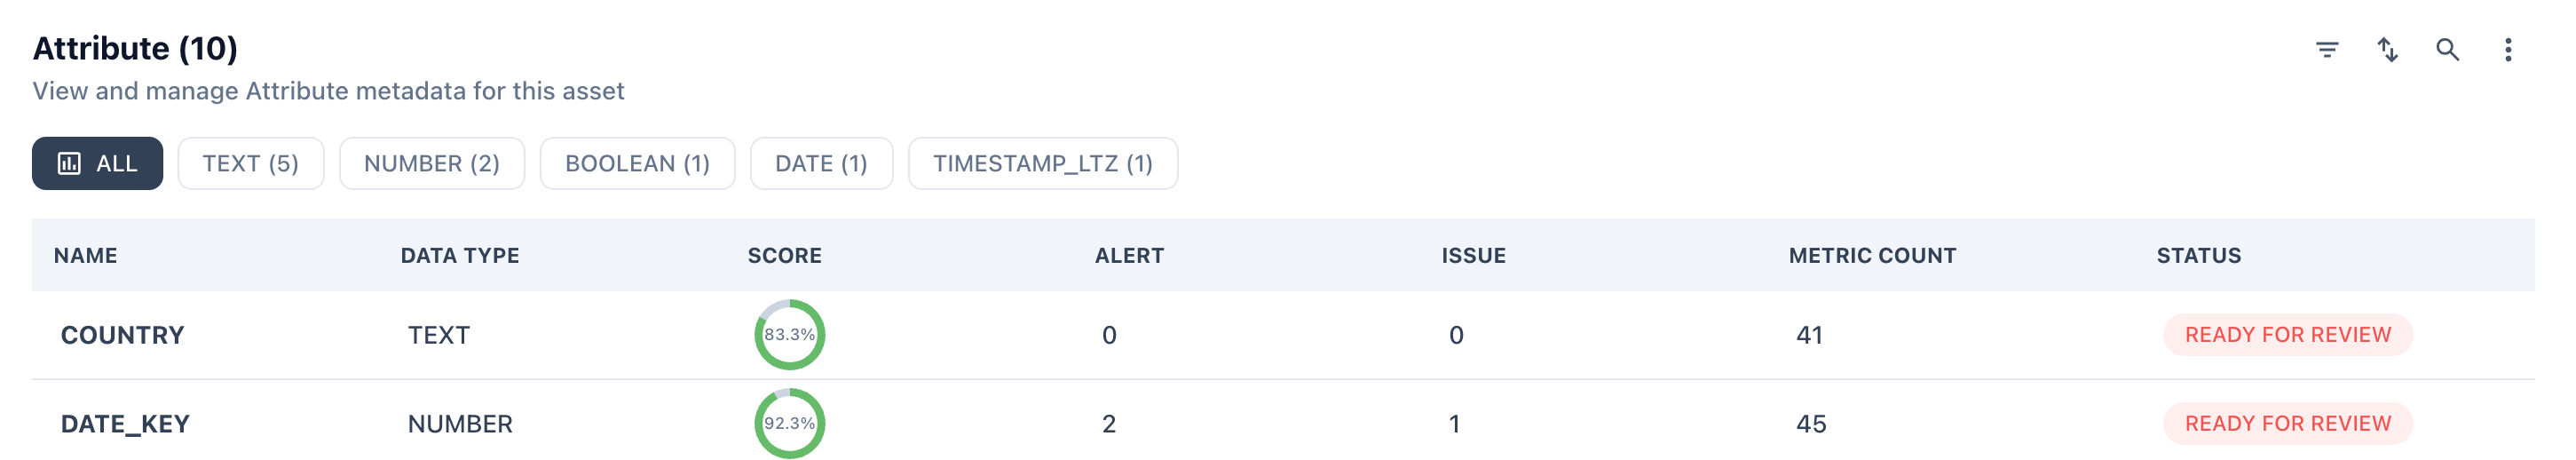
Grid Columns
A summary view of all child objects within an asset, displaying key metadata, quality scores, active alerts, open issues, tracked metrics, and workflow status at a glance.| Column | Description |
|---|---|
| Name | The name of the child object (e.g., a column name, schema name, or task name). |
| Data Type | Confirms the object’s type or, for attributes, its data type. |
| Score | Quality score for that individual child object, shown as a circular gauge; NA if not yet calculated. |
| Alert | Count of active alerts specific to that child object. |
| Issue | Count of open data quality issues tied to that child object. |
| Metric Count | Number of data quality metrics actively tracked on that child object. |
| Status | Workflow/review status of the child object (e.g., Ready for Review, Pending). |
Reading the Score Gauge
Each child object’s score is shown as a circular progress indicator, with color-coded segments reflecting different quality dimensions. A fully green ring near 100% indicates strong data quality across tracked metrics, while a lower or mixed-color score signals a component that may need investigation.Typical Use Cases
- Structural review — quickly confirm what child objects exist under an asset before relying on, querying, or building on top of it.
- Quality triage — sort or scan by Score, Alert, or Issue to identify which specific child objects are driving a parent asset’s overall quality problems.
- Coverage check — use Metric Count to spot child objects with little or no quality monitoring configured.
- Review tracking — use Status to track which child objects still need steward sign-off before the parent asset is fully governed.
Related Tabs
- Overview — asset-level summary and health.
- Data Profiling - sampling and baseline creation for anomaly detection and quality metrics.
- Metric — time-series quality trends for the asset and its child objects.
- Lineage — traces how the asset (and its components) connect upstream and downstream.